Close

Fuel your success and stay ahead in the industry with EdgePetrol’s Weekly Newsletter.

Set the RIGHT price for your stations

EdgePetrol connects to your point of sale, tanks and cost prices to bring key data points together in real-time, accessible from anywhere in the world.

Live volumes, weighted and blended margins and predicted tank levels are helping family owned and SME retailers achieve their goals.

Stations List USA

DATA TRANSACTIONS

WHAT exactly is weighted and blended margin?

Before EdgePetrol, most retailers were working out their margin based on either the most recent delivery or the cost if they were to take a tanker today. Previous deliveries were unaccounted for, leading to inaccurate margin calculations and sub-optimal pricing decisions.

By connecting directly to your point of sale, cost prices and the tank gauges underground, EdgePetrol is able to apply an exact cost to each delivery and blend these costs with previous deliveries that may have arrived at a different price.

As fuel leaves the tanks, we remove it on a FIFO (first-in-first-out) basis and recalculate, meaning that your margin is always live, preventing you from missing out on key pricing opportunities.

Live weighted and blended margin graphic

WHY is this important?

EdgePetrol blended cost US

Features designed to support YOUR business


Never look back with regret over unnecessarily lost volumes.

EdgePetrol provides live volume for each grade at each site. By knowing what is impacting your site performance today, you can make the changes you need to optimize profitability.

EdgePetrol retail volume US
Net Margin Tab EdgePetrol USA

See the impact of card transactions as they happen.

EdgePetrol identifies the card type used in each transaction and removes the cost to you as a retailer for accepting that card. This is then displayed as a ‘net margin’, which changes depending on the amount and the mix of cards used on any given day. Knowing how this fluctuation is impacting your overall profits can lead to more optimal decision making and less surprises when the card bills come in at the end of the month.


Action price changes quickly and correctly.

It’s all well and good finding the sweet spot, but it doesn’t change anything if your price is not amended on site. EdgePetrol allows you to send your price changes through the app directly to your Station Manager, and will alert you if that price change has not been made as directed.

EdgePetrol comparison widget
Last delivery date and Wetstock, EdgePetrol


Stop relying on replacement costs to calculate margin.

EdgePetrol calculates your margin based on the fuel that is actually in the tank. No longer do you have to rely on inaccurate numbers such as today’s replacement cost or last delivery cost to hit your margin targets. EdgePetrol also takes into account fuel cards to generate a ‘net margin’ number, so you can understand how profitable your fuel transactions really are.

COST PRICES AND WETSTOCK EXECUTION​


Net Margin subtracts fuel card fees from the gross margin. EdgePetrol sees which card is used via the PoS and subtracts the cost of accepting that card for that particular transaction from the margin. 

This is particularly important for sites that accept a lot of cards, as gross margin can offer a false sense of security before that fuel card bill comes in at the end of the month.

Gross margin is available at individual grade level, site level and portfolio level.

Net Margin subtracts card fees from the gross margin. EdgePetrol sees which card is used via the PoS and subtracts the cost of accepting that card for that particular transaction from the margin. 

This is particularly important for sites that accept a lot of cards or have cash/credit pricing, as gross margin can offer a false sense of security before that card bill comes in at the end of the month.

Gross margin is available at individual grade level, site level and portfolio level.

EdgePetrol connects to your Point of Sale to receive transactions in real time. Each of these transactions contains the amount of the grade sold, as well as the selling price. EdgePetrol tallies these transactions throughout the day, allowing you to see how each grade is performing by sales, average fill up, and number of transactions. You can also see how much fuel card and bunkering (if you have it) volume the site is doing today.

EdgePetrol also provides an indicator at both site and grade level comparing today’s performance to that of the previous six weeks, so you know whether or not you need to make a change.

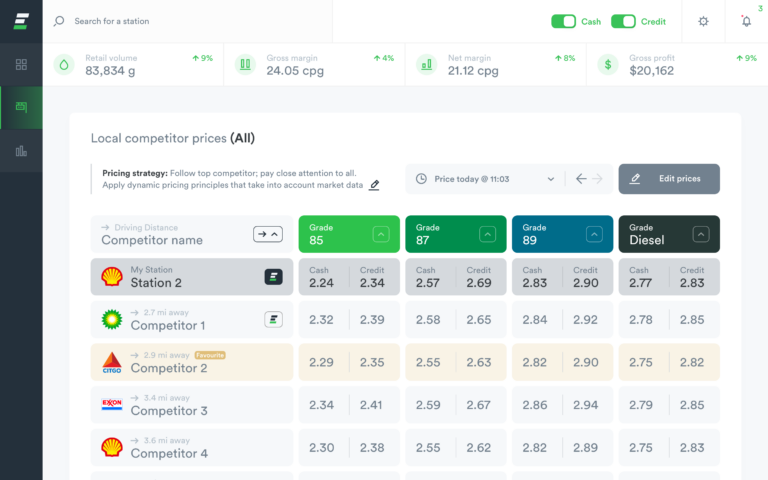
If you’re happy to share your pole sign price with other Edge users, you will also receive theirs! This will show up in your competitor pricing widget with an ‘E’ symbol, indicating that this price is live directly from your competitor’s point of sale.

Of course, EdgePetrol doesn’t have every site (yet), so we also partner up with Experian Catalist and similar companies that provide pricing data to the retail fuel market. These tools connect directly into EdgePetrol and the app will display the source of these prices and when they were last received.

EdgePetrol also allows you or your Station Manager to edit your prices. Station Managers can receive a restricted view of EdgePetrol where they can input the competitors price directly into the app without seeing any of the volume or margin data (unless you want them to).

Simply put, gross profit is the difference between your total fuel sales minus the cost of fuel sold. Net profit is gross profit minus the charges incurred by fuel cards. Business profit is net profit plus bunkering commission (if relevant).

EdgePetrol can connect directly to your wetstock management system, if you have one. We can also receive dips directly from your Point of Sale, if you don’t.

In order to show you the estimated time till your fuel tanks become empty we run a three step process in the background.

Firstly we make use of the historical sales for each of your tanks to understand their normal behaviour. We then apply a statistical model to forecast the sales of each tank for the upcoming 14 days. This is done on a daily basis so that the model always has the latest data and is able to adapt to any recent changes. 

After that, by using the latest dips of your tanks and all the transactions since the dip was taken we calculate the current volume of fuel left in your tank.

The last step is to calculate how many days the fuel in your tanks will last until they run dry. This is done by taking the current level of the tank and then subtracting our forecasted volumes until we get to 0 or negative volume.

Yes. EdgePetrol is accessible from any device.

Ready to see EdgePetrol in ACTION?

we value your privacy

We use cookies to improve the user experience on our website, in accordance with our privacy policyBy clicking “Accept & close”, you are consenting to our use of cookies.