6 Jun 2022
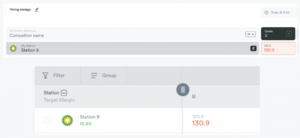
Every station owner wants their pole prices to be changed in a timely fashion. And we all know that just because you have sent a new price through to your Station Managers, it doesn’t mean it has been actioned - or actioned correctly. 😱 In our latest EdgePetrol product releases we have launched new UX…
2 Mar 2022
Ok, so we’re all about ditching those spreadsheets, but downloading your data was important to you.Which is why we are absolutely buzzing to share this news with you…We’ve added the functionality to download the data to a CSV file on the portfolio and station page performance reporting widgets!No more dragging the cursor awkwardly to the…
7 Jan 2022

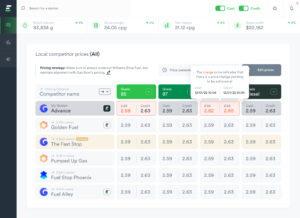
Navigation and Station Search · Easily navigate between your portfolio of stations and find a specific station using our search bar. Portfolio Header and Stations List · The portfolio header shows your key metrics and the trend indicators let you know how you are performing vs a previous point in time. · Volume performance indicators…